OpenPlant Orthographics Manager Help

Structural

The Structural annotation options page provides settings to define how the structural columns in a drawing are annotated. There are two options to place the structure labels. The labels will be placed in the two sides of the views.

Accessed by selecting the Annotations > Structural node in the Settings interface.

Define the properties per the fields described below and Save the changes.

The Close icon closes the Project Settings interface, so make sure your changes are saved. You will be prompted to save them it you haven't already.

The Load Defaults icon in the main Settings interface will return the settings of the options page to their original values.

SettingDescription
Label
Properties in this section define the display properties of the Slope Mark label.
  • Color: Click the icon and select a color from Color Table for the label text.
  • Text Type: Select a text type for the label from the drop down list. You can click the "..." option at the bottom of the list to display the Microstation Text Styles dialog allowing you to modify the text styles if desired.
  • Text Height: Enter a text height dimension into the field provided.
Leader and Size
Properties in this section define the display properties of the leader line.
  • Color: Click the icon and select a color from Color Table for the label text.
  • A Dimension: For the A dimension, refer to Flow Mark bitmap image when defining the distance.
Label Position

The label position section provides two drop down lists whose combined values determine the position of the column label:

Left View List Right View List
Up Left
Down Right
Both Both

As an example, if you select UP from the list on the left and LEFT from the list on the right, the structure column label will be displayed in the north and west direction of the view.

Label Overlaps Line Number

For a drawing with many external labels for components such as pipes and equipment, there is a possibility that those labels will overlap the structural labels (The priority of the structural labels place them first.) This can make the drawing appear complicated.
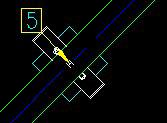
This option determines whether to allow the structural labels to overlap with other external labels.
  • Enabled: Allows you to overlap the structure label with other labels.
  • Disabled: Does not allow other labels to overlap with structure label
Note: If you disable this setting, you may have to re-position some of the other labels.
Column Grid Lines
The following setting define the display options of the grid lines for Columns in the drawing:
  • Show Column Grid Lines: When enabled, the column grid lines will display in the drawing. Disable to hide the grid lines.
  • Extension: Enter the extension of the grid lines in the field.
  • Color: Click the icon and select a color from Color Table for the label text.
  • Line Style: Select a style from the drop down list.
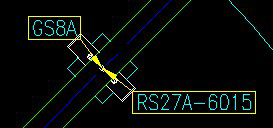
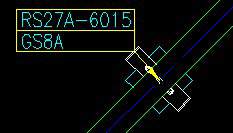
Structure Components

Orthogonal Style Leader: There are many orthogonal lines in the piping drawing. So it is useful to use the Non-orthogonal style leader line for distinguishing it from other orthogonal lines, which may be the pipes.

The Ortho Style Leader option toggles whether a Orthogonal or Non Orthogonal leader is used. As you toggle the option, the example reflects how the option will display:

Orthogonal

Non-Orthogonal

Only horizontal tag direction: Check this option if you want to display all of the Structure Component annotations in the Horizontal direction.

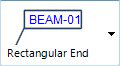
Label: Properties in this section define the display properties of the Beam label.
  • Color: Click the icon and select a color from Color Table for the label text.
  • Text Type: Select a text type for the label from the drop down list. You can click the "..." option at the bottom of the list to display the Microstation Text Styles dialog allowing you to modify the text styles if desired.
  • Text Height: Enter a text height dimension into the field provided.
Leader: Properties in this section define the display properties of the Leader line.
  • Color: Click the icon and select a color from Color Table for the label text.
  • A and B Dimensions: For the A and B dimension, refer to bitmap image next to the fields when defining the distance.
  • Arrow Type: Select the arrow type to use for the leader line from the list of options.

    The User Defined option displays the Select User Defined Arrow dialog letting you select an arrow symbol from a cell library.

Mode of Express
This option determines how Structural annotation is displayed:
  • Normal: Default mode displays the tag information for the structural component.
    Note: The image below is for a support but the annotation format would be the same for structural.
  • Grouping: If more than one structural tag is defined for the same position, they will be grouped together.
    Note: The image below is for a support but the annotation format would be the same for structural.
  • Chart: Structural components are annotated with a number which corresponds is matched to information stored in the Support Chart which will be placed in the drawing.
    Note: The image below is for a support but the annotation format would be the same for structural.